
Data Analytics
Channel data into insights
Transform data into meaningful, actionable insights
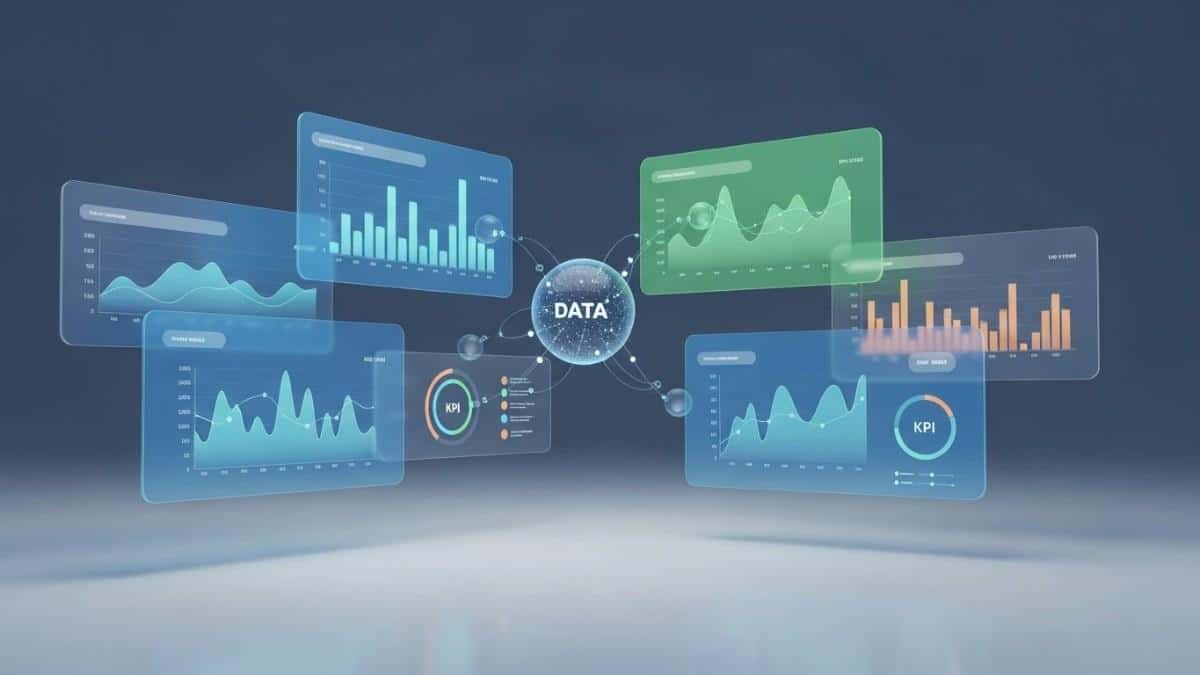
Turn your data into a competitive advantage. Unify, automate, and visualize data to make faster, smarter business decisions with confidence.
Technologies & tools covered






Power analytics with trusted, analytics-ready data
Enable business intelligence and analytics by streamlining how data is ingested, transformed, and prepared for reporting. We help organizations build reliable data workflows that ensure dashboards and insights are always driven by accurate, timely, and well-structured data.
Unify
Consolidate and prepare data from multiple sources for analytics and BI.
Transform
Apply consistent transformations to deliver analytics-ready datasets.
Automate
Automate data pipelines to support reliable reporting and insight generation.
"Data Science Dojo came to my company at a dire time. We didn't have enough people to do the amount of work required. They swiftly understood the tasks at hand and seamlessly collaborated with us. We were able to deliver exactly what our stakeholders needed on schedule. The team went above and beyond. It was such a great partnership. We're still working with them on more projects. Don't hesitate to get DSD to help your company."
Unified marketing analytics for data-driven growth
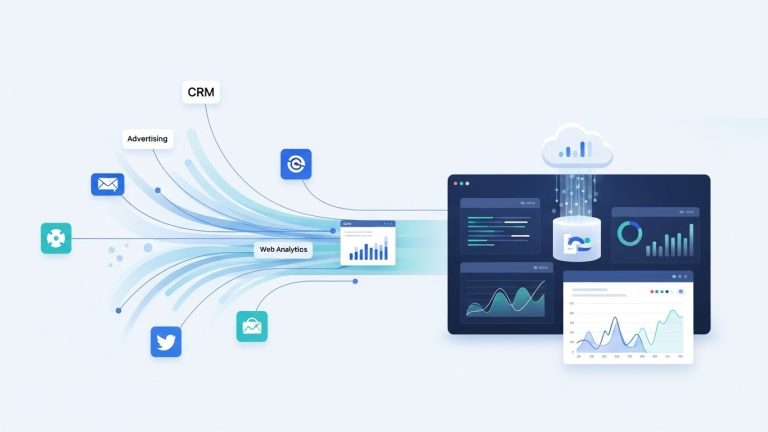
Marketing teams rely on data from multiple platforms such as CRMs, ad networks, and social channels, but these systems often operate in silos. We help organizations bring marketing data together into a unified analytics environment, eliminating manual exports and fragmented reporting.
By automating data ingestion and building standardized Power BI views, teams gain a clear and consistent understanding of campaign performance, lead activity, and channel effectiveness. Our analytics solutions are designed to scale as business needs evolve — with secure, cloud-based architectures that support reliable refreshes and fast reporting, while enabling internal teams to manage and extend dashboards independently.

Enterprise financial analytics
Finance teams often struggle with fragmented reporting across systems, sites, and spreadsheets, making it difficult to gain a reliable view of working capital performance. We help organizations centralize financial data from ERP and accounting systems into a single analytics layer, enabling consistent tracking of key metrics such as receivables, payables, and inventory.
Standardized calculations and automated refreshes eliminate manual consolidation, delivering reliable reporting for quicker, smarter financial decisions. Our financial analytics solutions support both corporate oversight and operational detail — interactive dashboards give leaders enterprise-wide visibility while allowing finance teams to drill into site-level and transactional data.
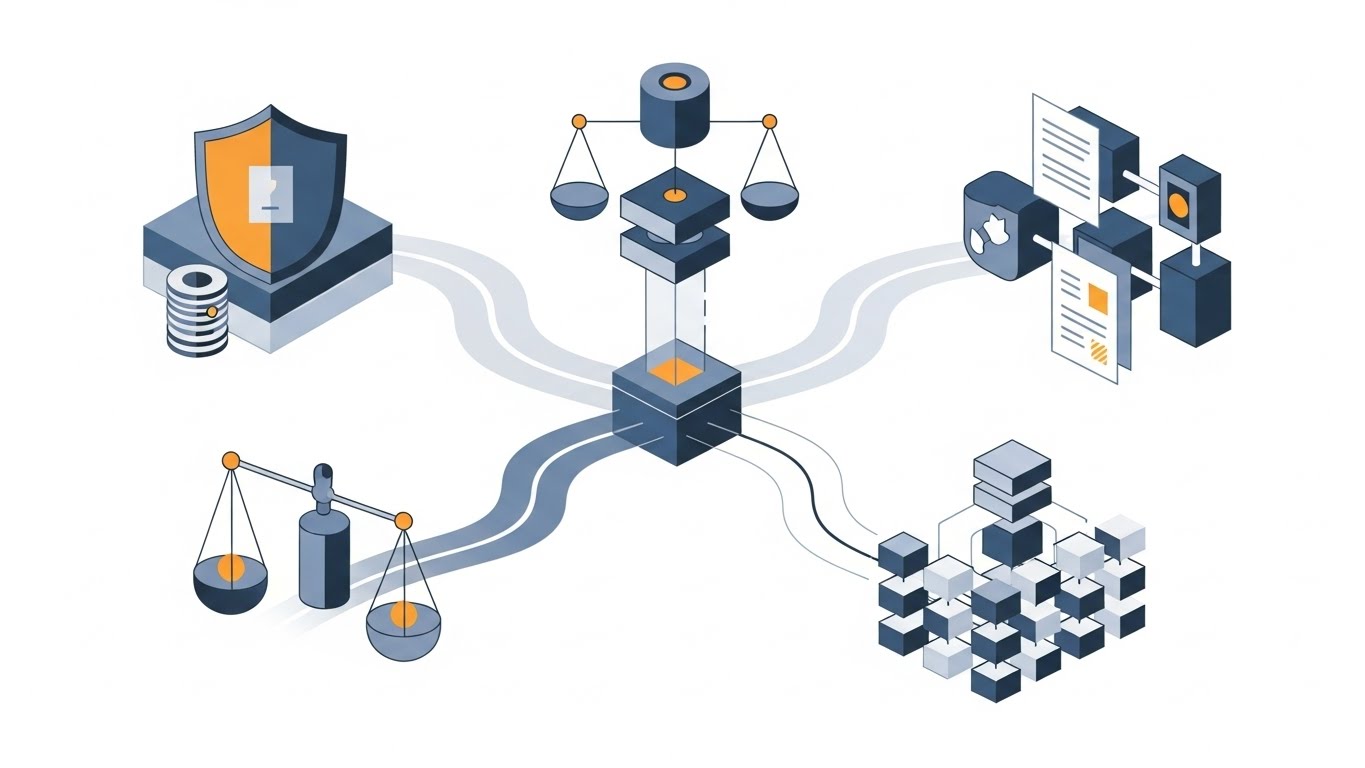
Compliance analytics and risk visibility
Organizations face increasing regulatory demands across privacy, security, and industry standards, yet compliance data often lives across logs, spreadsheets, ticketing tools, and audit systems. We help companies centralize compliance information into a single analytics layer, enabling tracking of key metrics such as CAPA timeliness, deviation trends, and change control performance.
Our solutions provide leadership and compliance teams with reliable, real-time visibility into risk posture. By standardizing metrics, automating data pipelines, and data refresh, we cut audit effort, reduce exposure, and enable continuous improvement.
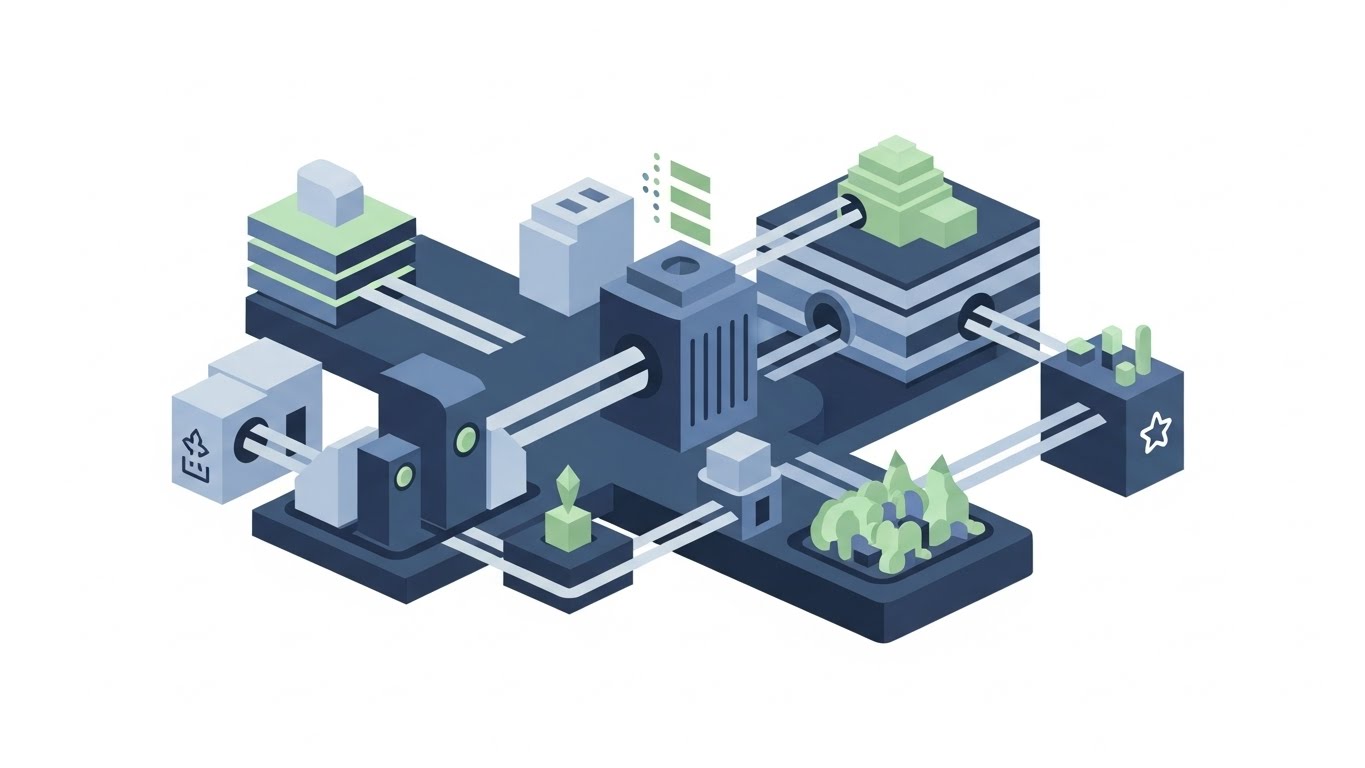
Operational analytics
Operational performance is often hidden across multiple systems. We create unified dashboards that track throughput, cycle time, utilization, downtime, and cost drivers in a single, consistent view — offering leaders real-time insight into where performance is lagging and why. With standardized KPIs and automated reporting, teams can pinpoint bottlenecks, reduce waste, and improve service levels. Our approach supports continuous improvement, enabling faster, data-driven decisions on staffing, capacity, maintenance, and process optimization.

Product analytics
Product teams need to understand how customers actually use features, not just what they say. We consolidate event data, feedback, and support trends into cohesive product analytics, revealing adoption patterns, friction points, and behaviors tied to outcomes such as retention and upsell. By aligning product metrics to business goals, teams can prioritize the right roadmap investments, validate releases faster, and reduce time spent debating data. The result is a continuous learning loop that increases product value, improves user experience, and accelerates growth.
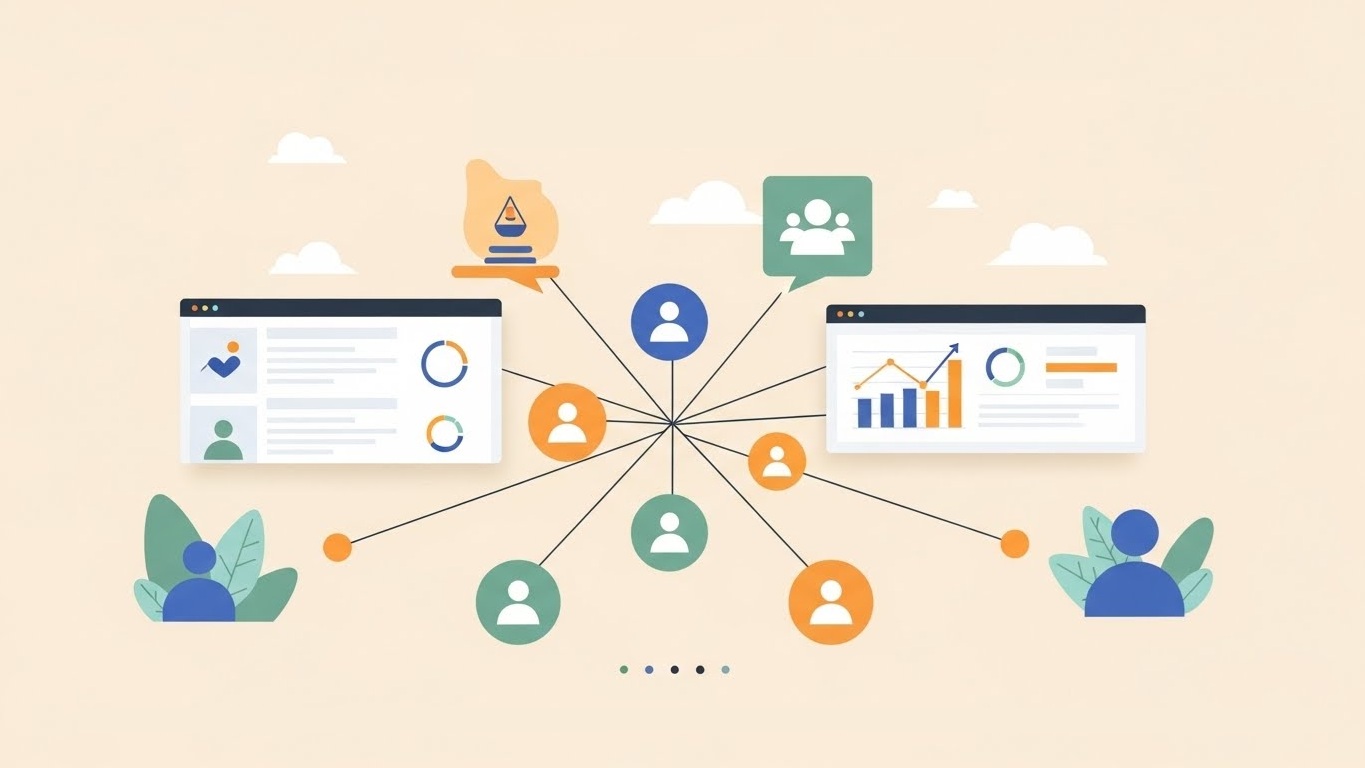
HR & people analytics
HR leaders manage hiring, retention, engagement, and performance, but disconnected HR systems, surveys, and spreadsheets make it difficult to understand workforce trends. We integrate people data into a unified analytics environment, providing clear insight into headcount, turnover, recruiting funnels, compensation, and engagement metrics. With intuitive, role-based dashboards, leaders can identify retention risks, improve workforce planning, and measure the impact of HR initiatives over time.
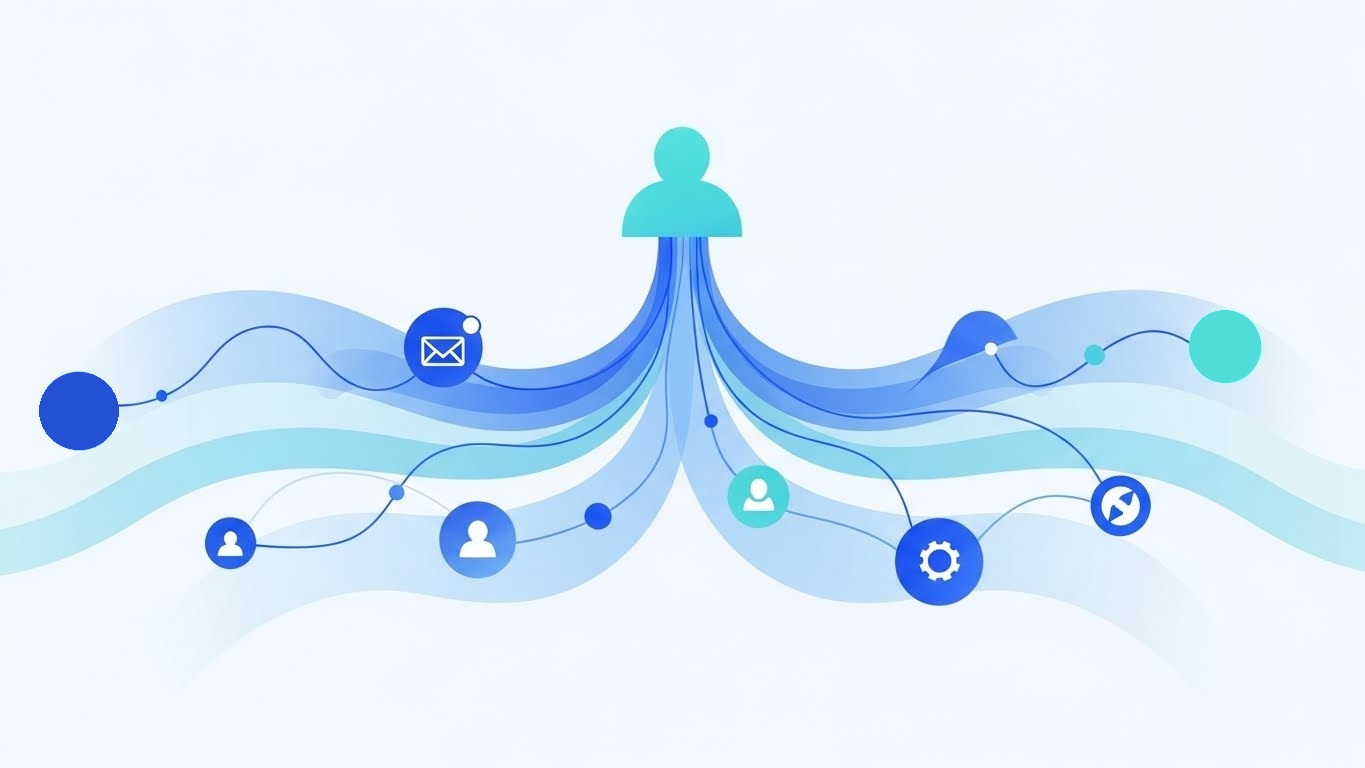
Customer & CRM analytics
Every interaction with a customer tells part of a story: sales calls, support tickets, campaigns, and renewals. When those stories live in separate tools, teams can only see pieces. We bring all customer data together in one place using automated data pipelines and interactive dashboards — so teams can see who is buying, who may be at risk of leaving, how customers interact over time, and which activities lead to better relationships.
Inventory & supply chain analytics
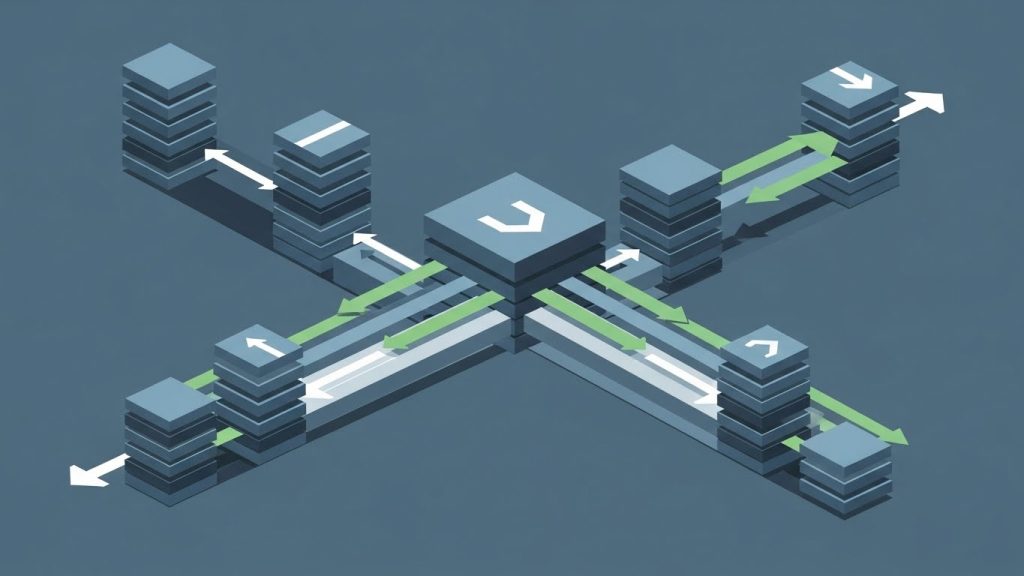
Many companies struggle to keep the right products in stock because inventory data is scattered across spreadsheets and different systems. We bring all inventory and supply chain data together into one clear dashboard. Teams can see stock levels, track orders, check supplier performance, and spot potential issues before they become problems — reducing stock shortages, avoiding overstocking, and saving money.

Sales analytics
Sales performance data is often scattered across CRMs, spreadsheets, and forecasting tools, making it hard to see the full picture. We integrate these sources into a centralized analytics environment that provides a reliable view of sales performance. Interactive dashboards and standardized metrics allow leaders to identify top-performing representatives, track conversion rates, and monitor forecast accuracy in real time — connecting sales, marketing, and product insights to drive revenue growth.
Case study
Unified compliance analytics for a global pharmaceutical manufacturer
Partnering with Data Science Dojo, the client experienced significant benefits:
- Delivered 100+ interactive Power BI dashboards, providing real-time insights for both site-level operations and leadership decisions.
- Empowered leadership with instant visibility into cross-site quality metrics, enabling proactive, data-driven decision-making.
- Automated data ingestion and refresh cycles, cutting manual reporting time by 80% and freeing teams for strategic work.
Featured resources
View all posts →Data Analytics
Essential data analysis methods for business success
An overview of data analysis, the data analysis methods, its process, and implications for modern corporations.Data Science
Supercharge data science in Microsoft Fabric: Train and deploy predictive models
Discover how Microsoft Fabric streamlines the ML lifecycle, train, manage, and scale predictive models while turning data into actionable insights.Data Visualization
Empowering business analysts: Master data visualization
Discover essential data visualization techniques every business analyst should know to make data-driven decisions and present insights effectively.Data Engineering
Effortless integration: Connecting LinkedIn API to Azure Synapse / data factory for centralized marketing analytics in Power BI
Learn how to connect LinkedIn's Community Management API with Azure Synapse or Data Factory to build data pipelines for post analytics and Power BI dashboards.Data Analytics
Data analyst's guide to transform data into insights
Learn how a data analyst leverages Power BI to turn data into insights and drive data-driven decision-making by reading this detailed guide.Frequently asked questions
- How does BI differ from simple reporting?
- Unlike basic reporting, BI provides interactive dashboards, real-time insights, and analytics-ready data models that help guide strategic and operational decisions.
- What business challenges can data analytics and BI help solve?
- Data analytics and BI help organizations transform data into actionable insights that support better decision-making, improve operational efficiency, and align performance metrics with business objectives.
- Which data sources can you integrate for analytics?
- We consolidate data from multiple systems — CRMs, financial systems, marketing platforms, databases, and more — so teams can analyze insights from a unified view.
- How do you ensure data is analytics-ready?
- We build reliable data pipelines that prepare, transform, and standardize data to ensure it's accurate, timely, and trusted for reporting and analytics.
- Can you build dashboards tailored to specific teams?
- Yes. We design interactive, role-based dashboards — e.g. marketing, finance, operations — that deliver actionable insights relevant to each team's needs.
- What tools are used for data visualization and BI?
- Our analytics solutions commonly use Power BI and Tableau to generate secure, scalable dashboards and reports that empower business users.
- How do analytics solutions scale as business needs grow?
- We implement secure, cloud-based architectures and well-documented data models so analytics environments can expand with evolving requirements.
Struggling to turn your data into actionable insights?
Let's build the analytics foundation your business needs.